
The dashboard at a glance
After logging in you land on the dashboard. That screen answers the question every administrator has: how is my agent doing, and does anything need my attention? You don't have to dig for it; the key signals sit together and every block links to the place where you can adjust things.
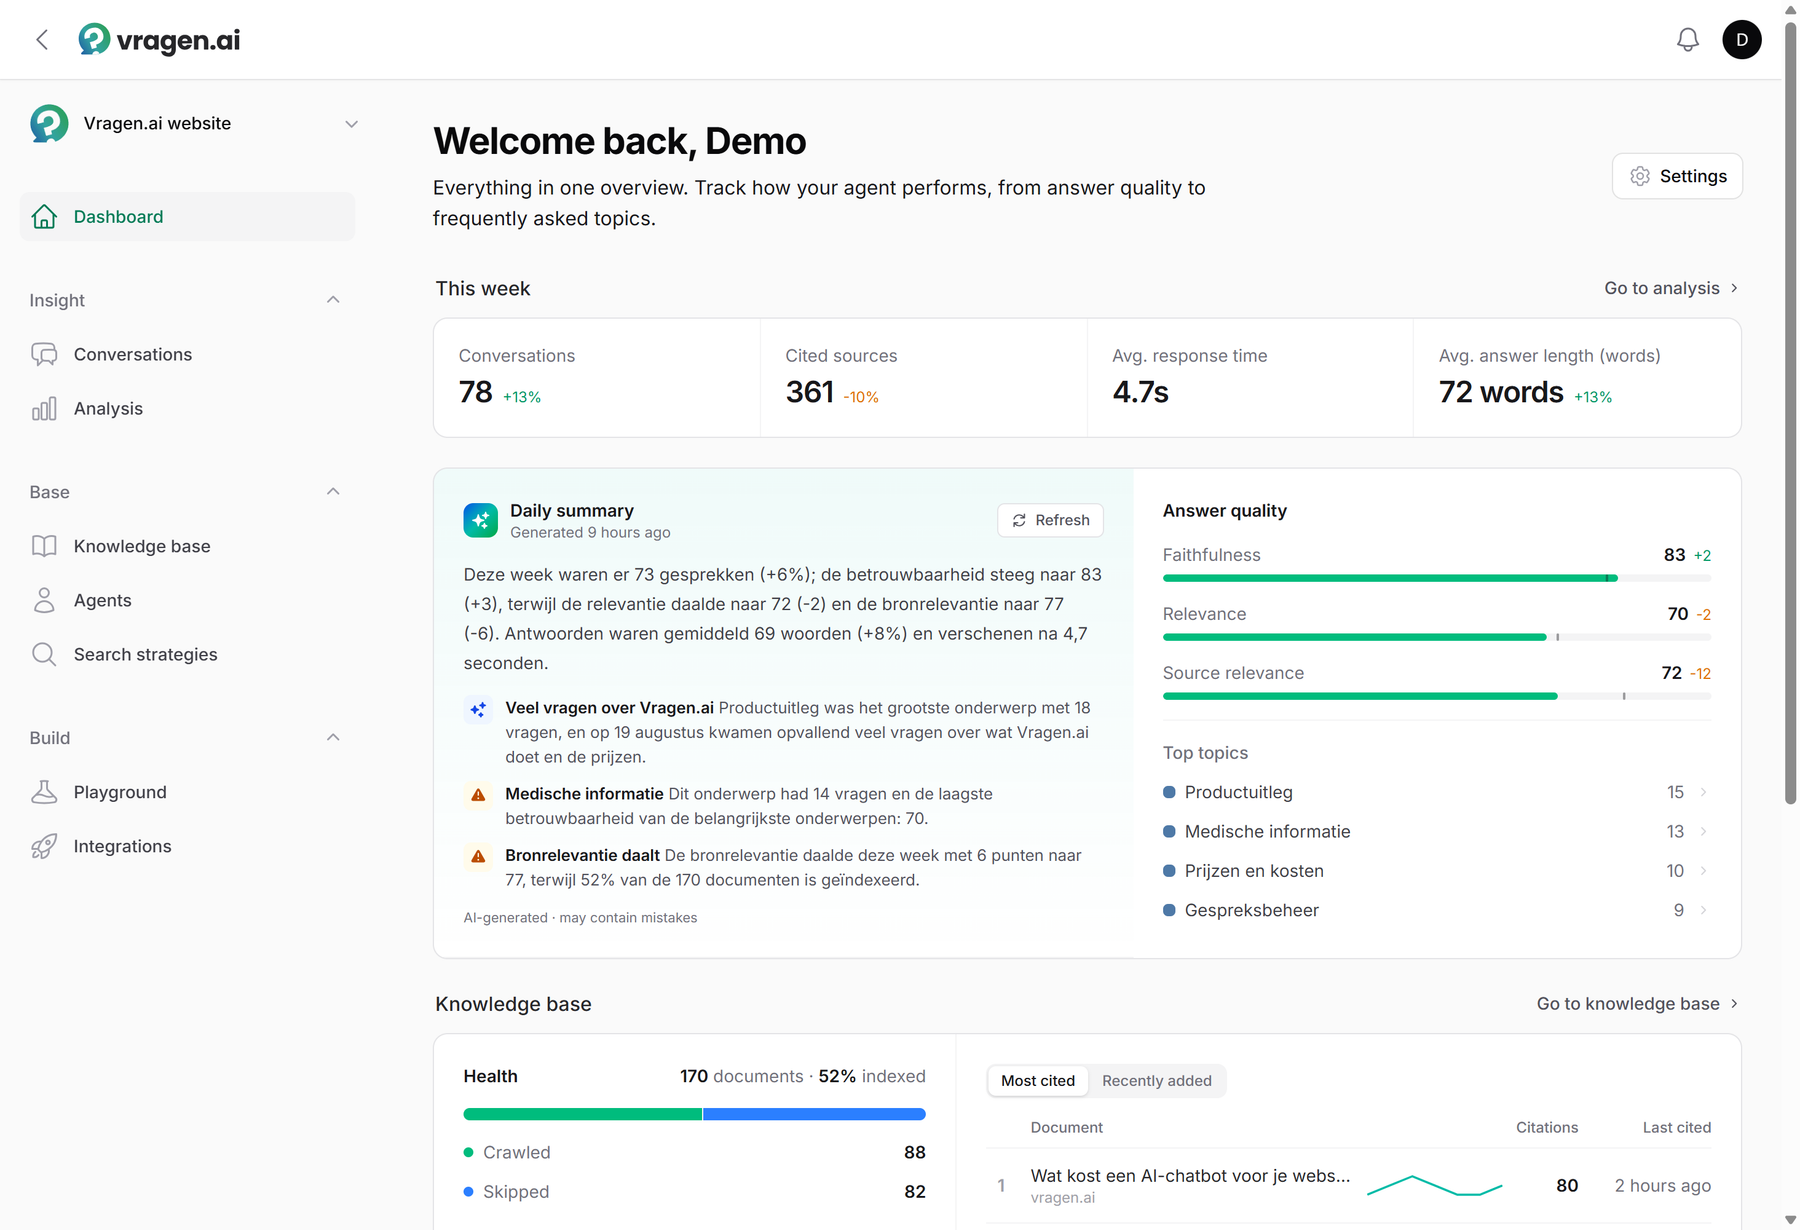
This week in four numbers
At the top you see the core numbers for the past seven days: the number of conversations, the number of cited sources, the average response time and the average answer length in words. Next to most numbers you see how they compare to the seven days before, so an outlier stands out right away. The conversation count is clickable: it opens the inbox with the conversations from those seven days. Response time is the exception: measured across all conversations, it tells you how quickly the answer starts to appear. More conversations after a campaign, or longer answers after a content change: this is where you notice it first.

The daily summary
Every day vragen.ai writes a short summary of what happened in your conversations: how the numbers are moving, which topics stood out and where something needs attention. In half a minute you read what you would otherwise piece together from separate charts. Want a fresh version, for example right after a content update? Request one with the Refresh button.
The summary is AI-generated and may contain mistakes; it says so right below it. Use it as a starting point and always double-check a striking signal in your conversations. The summary is written in your account's dashboard language, which you find under Settings. That setting is separate from the interface language each user picks; in the screenshots the interface is English while this account writes its summaries in Dutch.
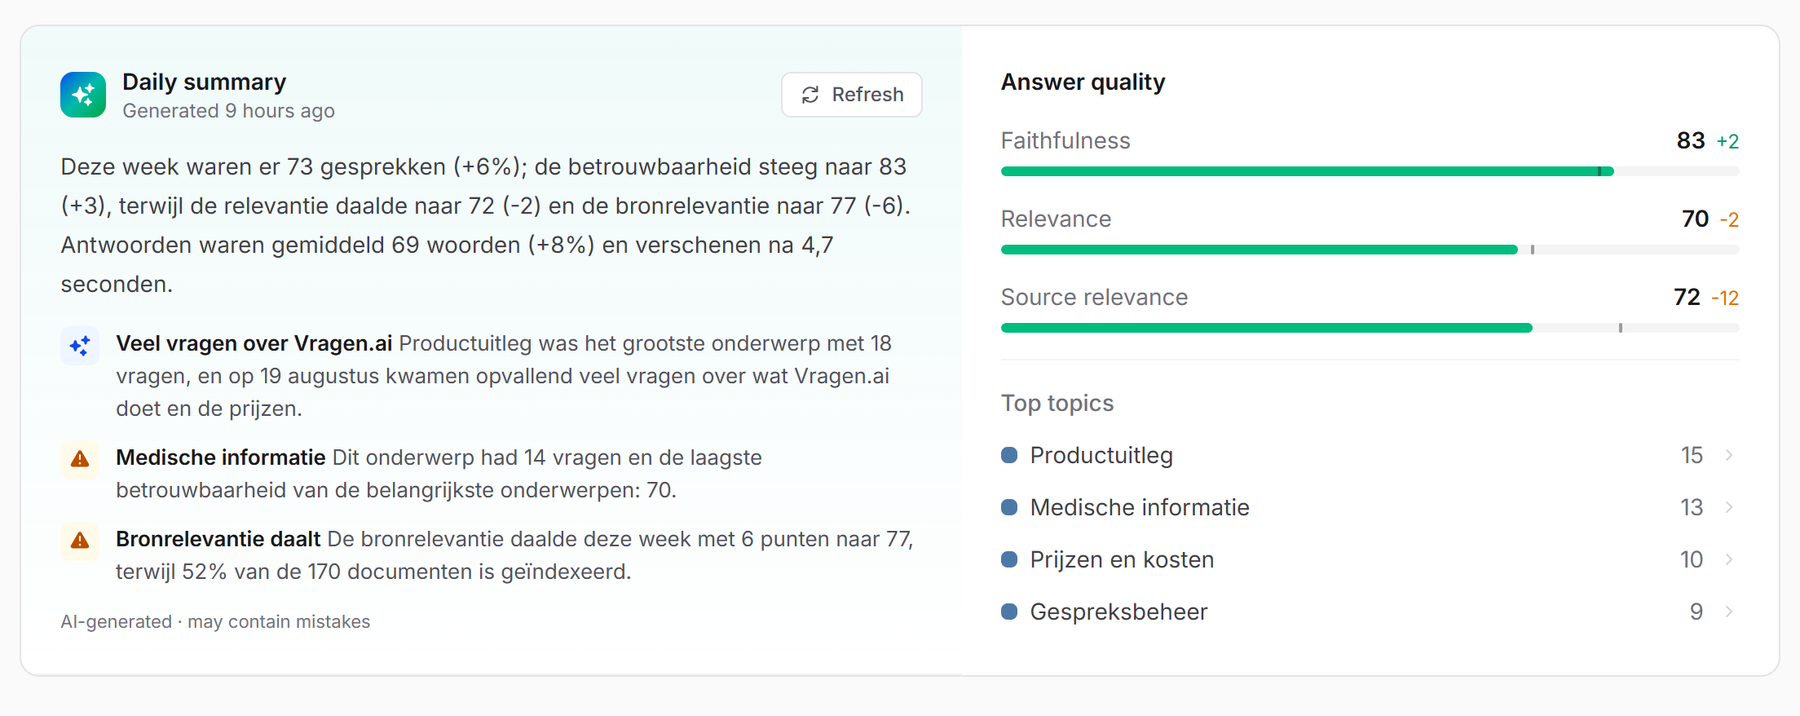
Answer quality: three scores
Next to the summary you find the three evaluation scores vragen.ai keeps for every answer, here averaged over the past seven days: faithfulness, relevance and source relevance, each on a scale from 0 to 100. What the scores mean exactly, and what to do when one of them is structurally low, is covered in Testing and evaluating.
The dashboard also shows how each score moved compared to the seven days before. A dropping score is not an alarm, but it is a reason to click through and look at the conversations behind it.
Top topics
Here you see what visitors asked about most this week, grouped by topic. That is more than a nice list: it tells you what is on your visitors' minds right now, and which content deserves to be in shape first. Clicking a topic takes you to the analysis with all related conversations.
The health of your knowledge base
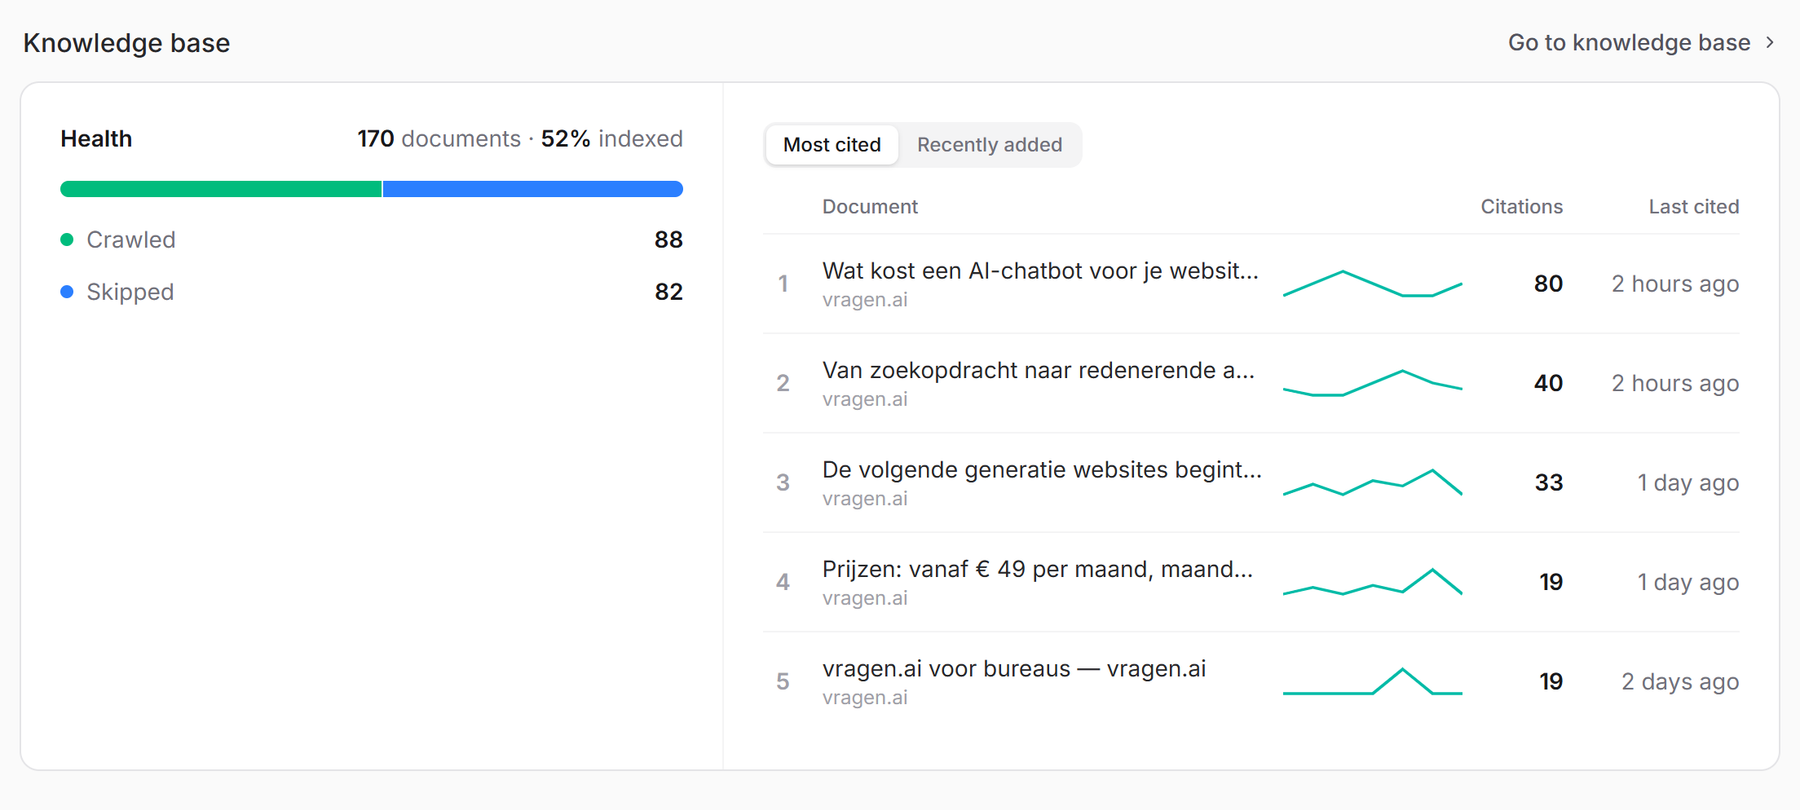
The knowledge base block shows how many documents your knowledge base contains, which share of them is indexed, and how many pages the crawler skipped or could not process; if a document really needs attention, a button takes you straight to it. Next to that you see, switching between two small tabs, which documents are cited most in answers (including their trend) and what was recently added. That way you know whether your content is actually being used. How the crawler reads your content, and why a page can be skipped, is explained in The crawler and your content.
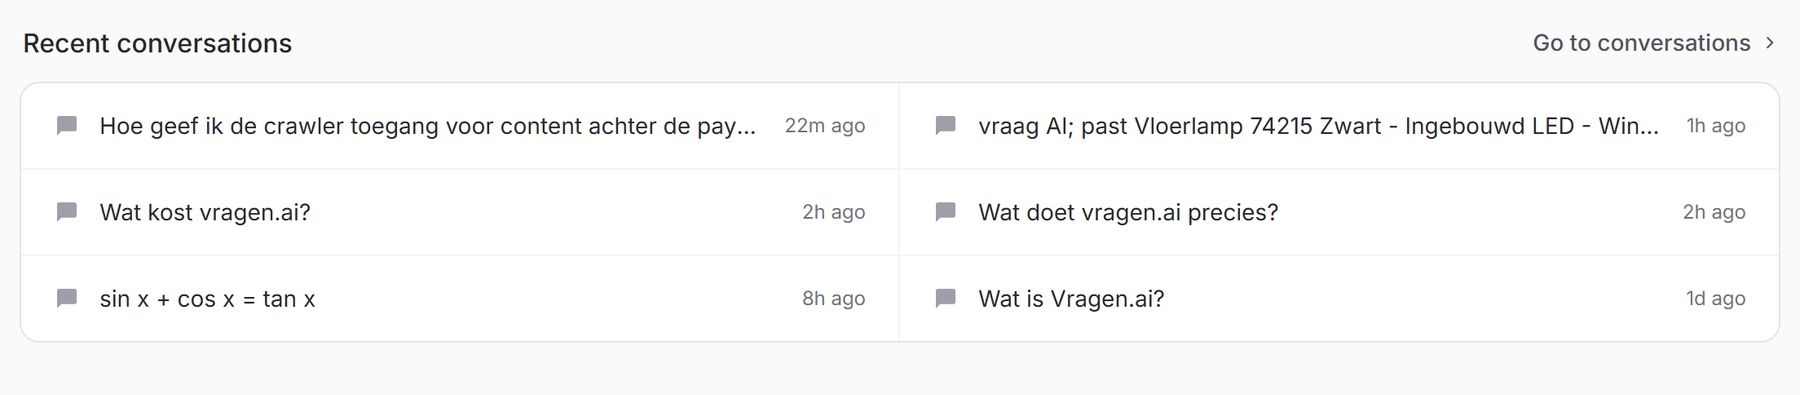
Recent conversations
At the bottom you find the latest questions visitors asked, with a timestamp. The small icon in front already tells you whether a conversation got positive or negative feedback or was flagged, before you even open it. It works well as a quick sample: open a conversation and you immediately see what someone asked and which answer they got.
Your environment's settings
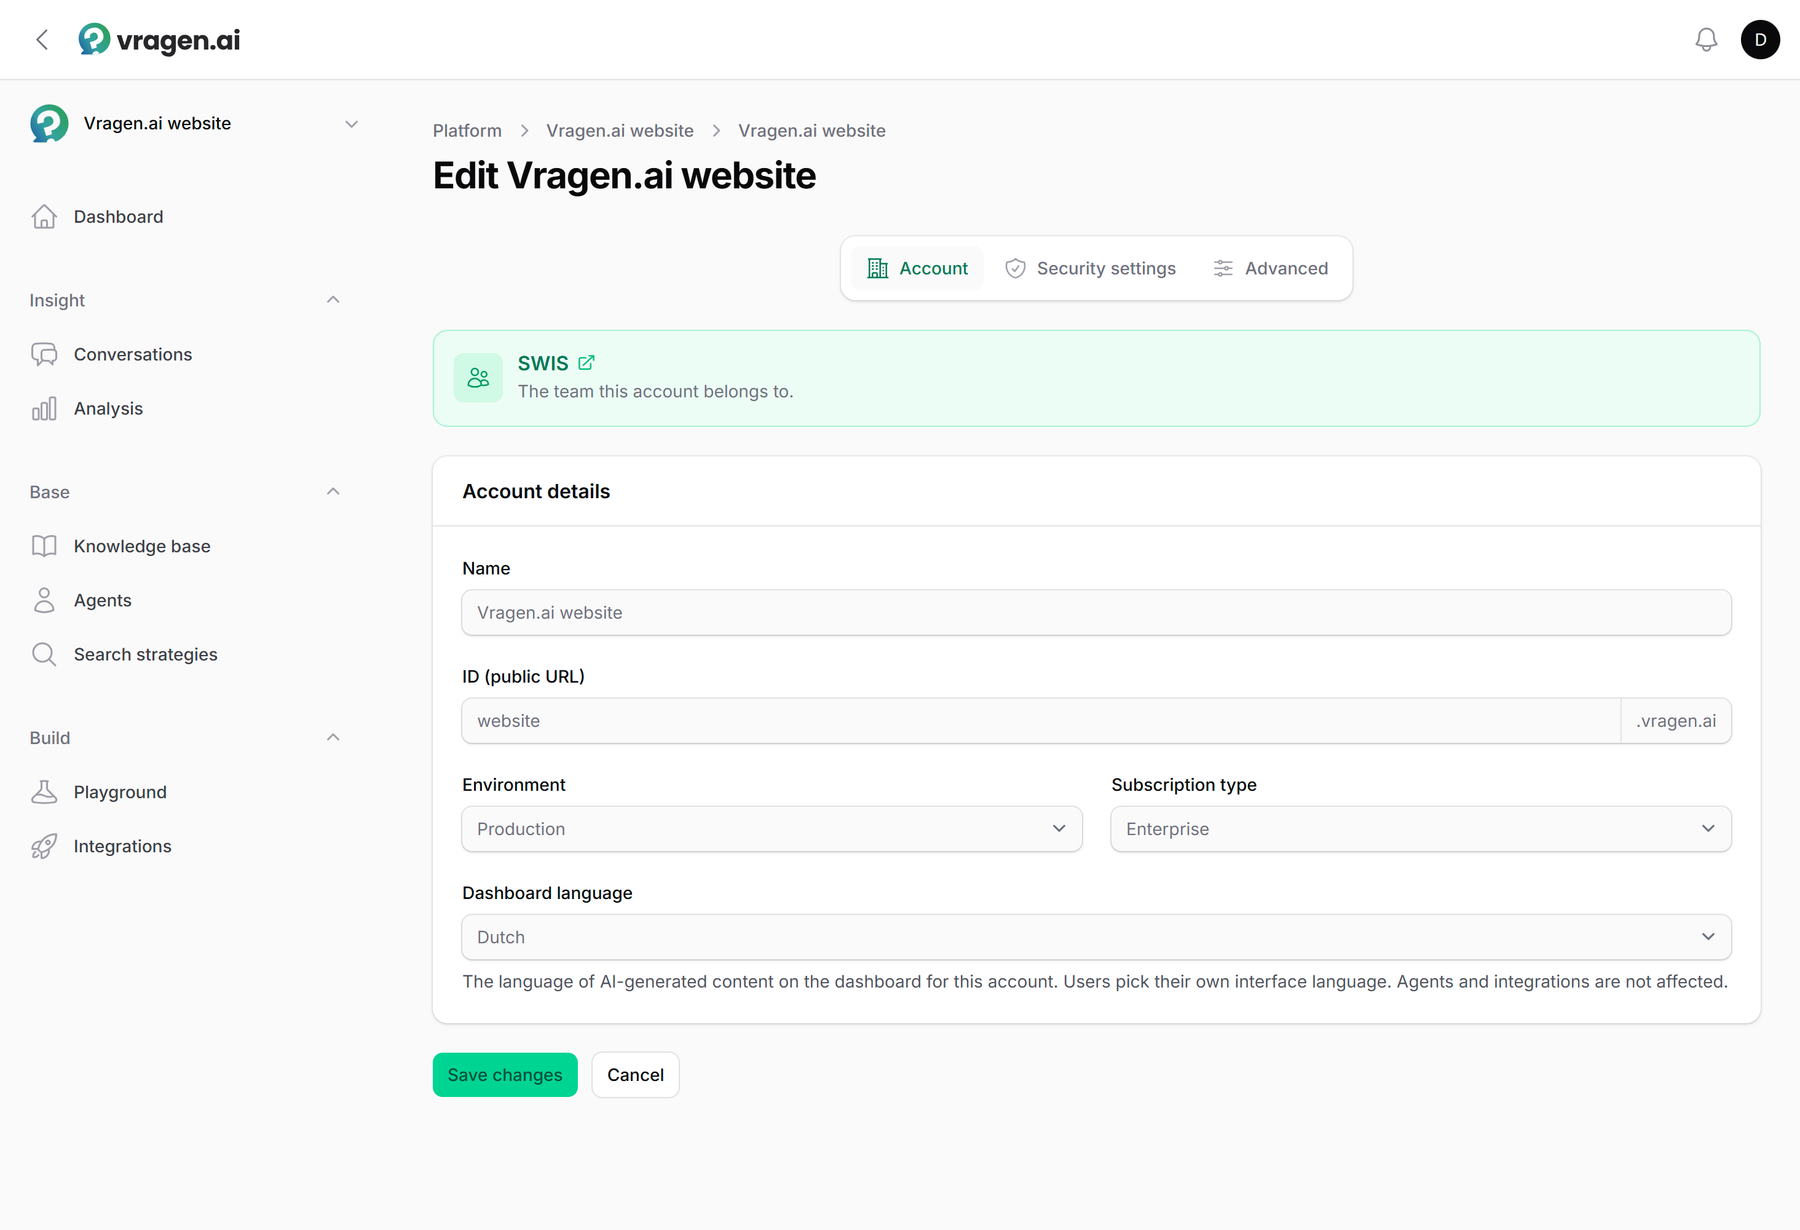
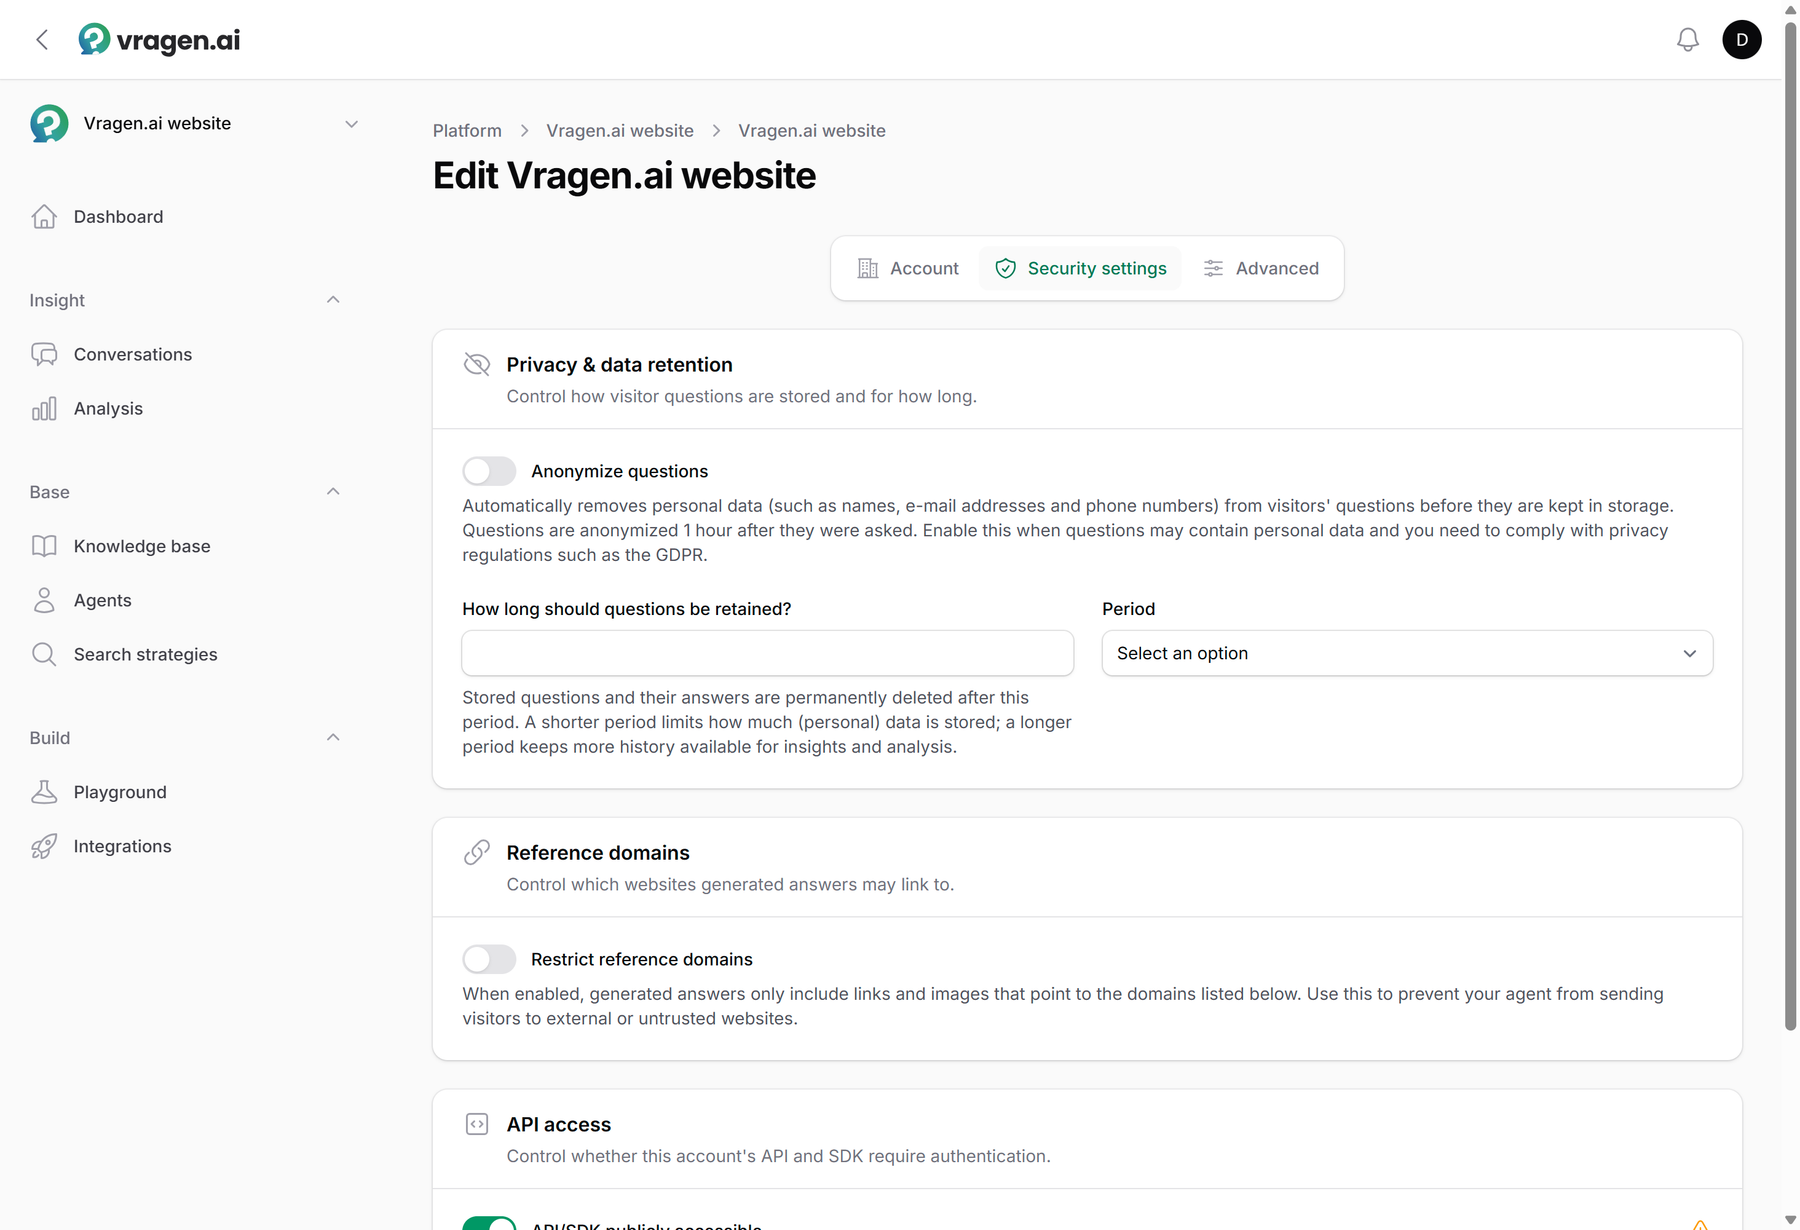
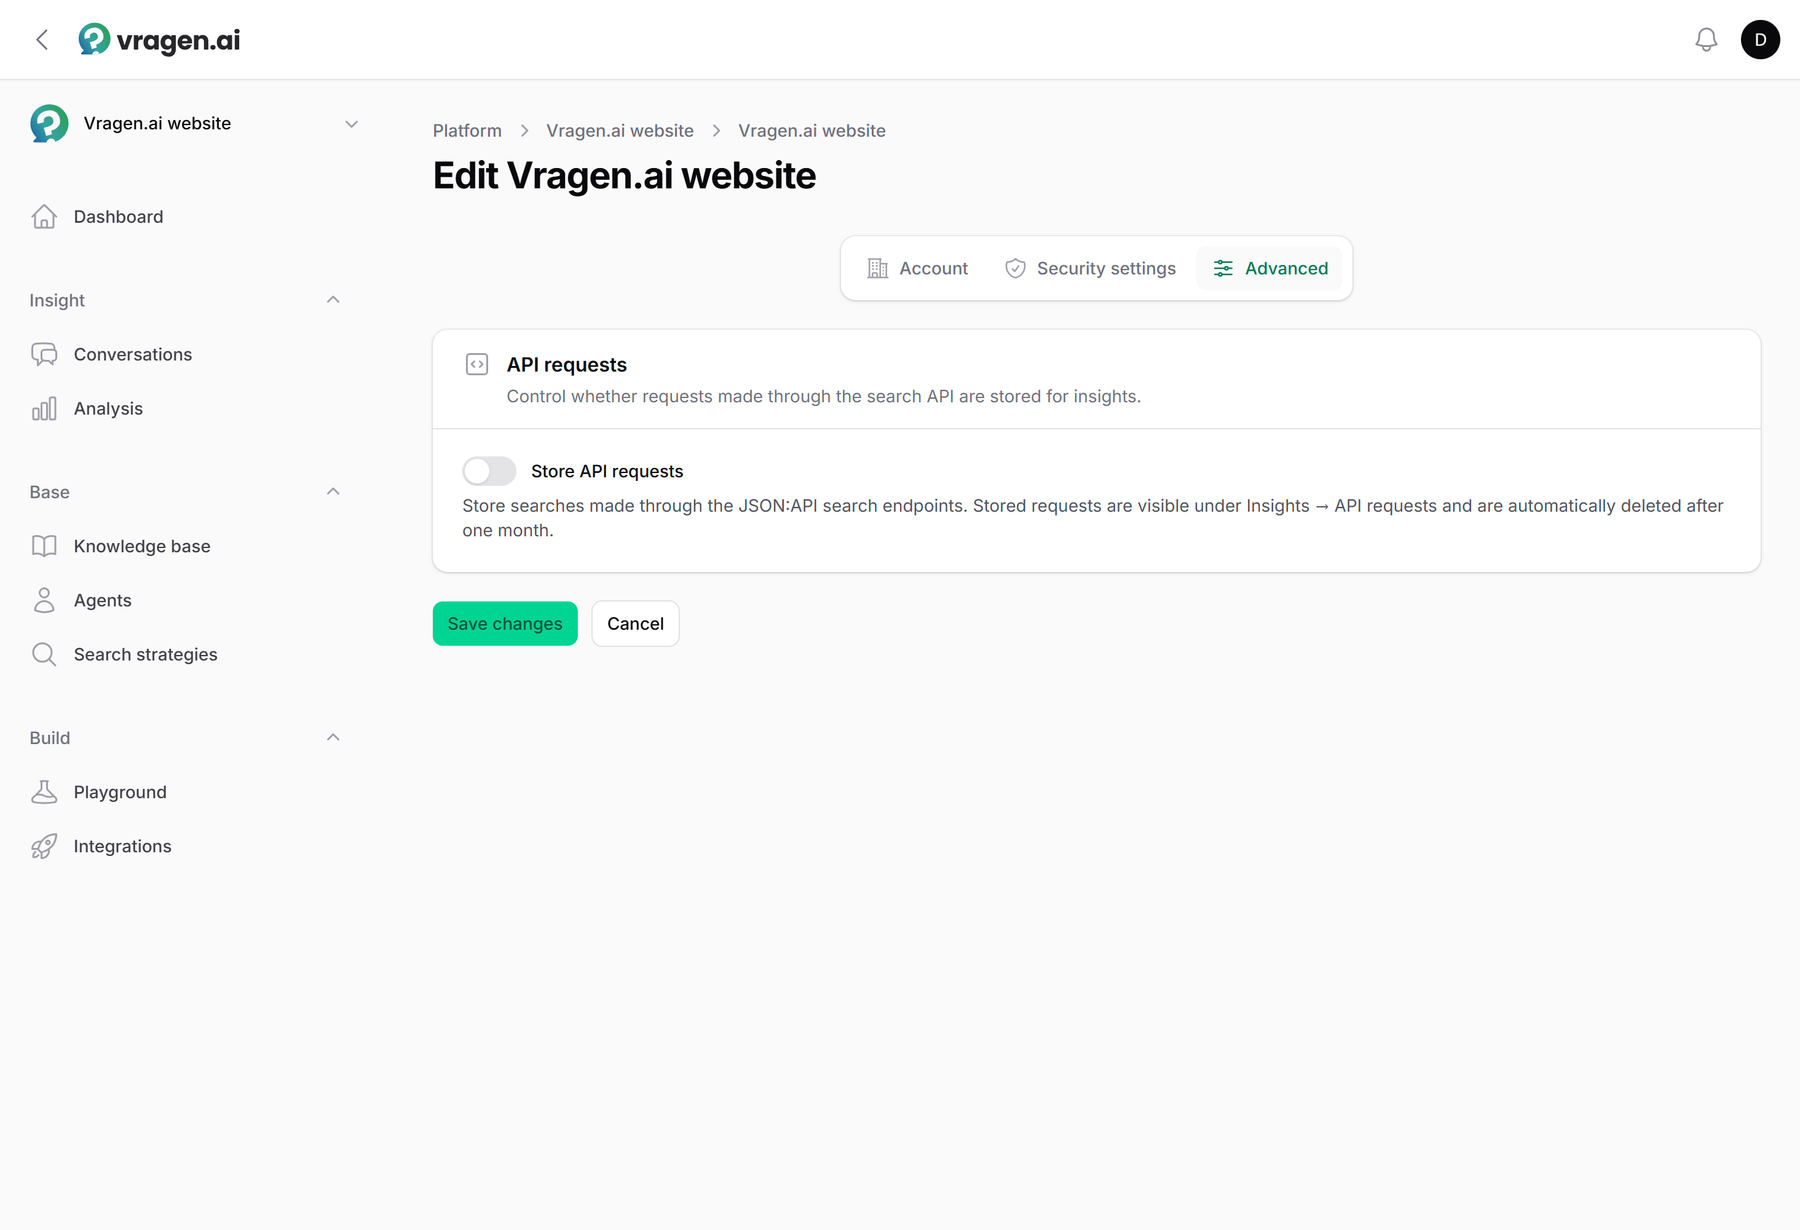
At the top right of the dashboard sits the Settings button. Behind it live your environment's settings, in three tabs:
- Account: your environment's name and the dashboard language, the language the daily summary is written in. These details are shown for reference; changing them runs through vragen.ai, so email service@vragen.ai if something here should be different.
- Security settings: how visitor questions are handled, and who may use which part of your environment. Only an Owner sees this tab. With Anonymize questions, vragen.ai automatically removes personal data (such as names, email addresses and phone numbers) from questions, one hour after they were asked; switch this on when questions may contain personal data and you need to comply with privacy legislation such as the GDPR. The retention period decides how long questions and answers are kept before they are permanently deleted: shorter means less stored data, longer means more history for your analyses. With How long can an anonymous conversation be picked up again? you choose for how many hours a visitor without an account can still reopen or continue a conversation through its link; the default is 24 hours. You can also restrict reference domains here, so answers only link to websites you specify. Finally, in the Access section you decide who may use three parts of your environment: the Widget, the Documents (such as uploads and the images in answers) and your knowledge base's MCP server. Each one is open to anyone, or only to signed-in users and API tokens of your environment. Existing environments keep the access they already had. How to use a restricted widget on your site anyway is covered in The widget in a locked-down environment; the MCP server in Knowledge base as an MCP server.
- Advanced: whether search queries made through the search API are stored. Switch it on and Search queries appears under Insight, where you read back what was searched through the API and the search modules of your CMS (see Conversations). Stored search queries are automatically deleted after one month.
Where your data lives and how storage is arranged is covered in Hosting and data storage.
From signal to action
The dashboard is the starting point of the improvement cycle. See faithfulness dropping? Start an optimization round. Does a top topic point to a question your site has no good answer to? Then add to your knowledge base. And if indexing lags behind, look at the crawler. Can't figure it out? Email service@vragen.ai; we're happy to take a look with you.