
Analysis: from questions to themes
Reading back individual conversations is instructive, but with dozens of questions a day you want the bigger story: what are visitors really asking about? Analysis answers that question. Every question is automatically grouped into themes and topics, and you see in one screen where your content performs and where visitors are missing something. For anyone responsible for content, this is the screen next week's writing comes from.
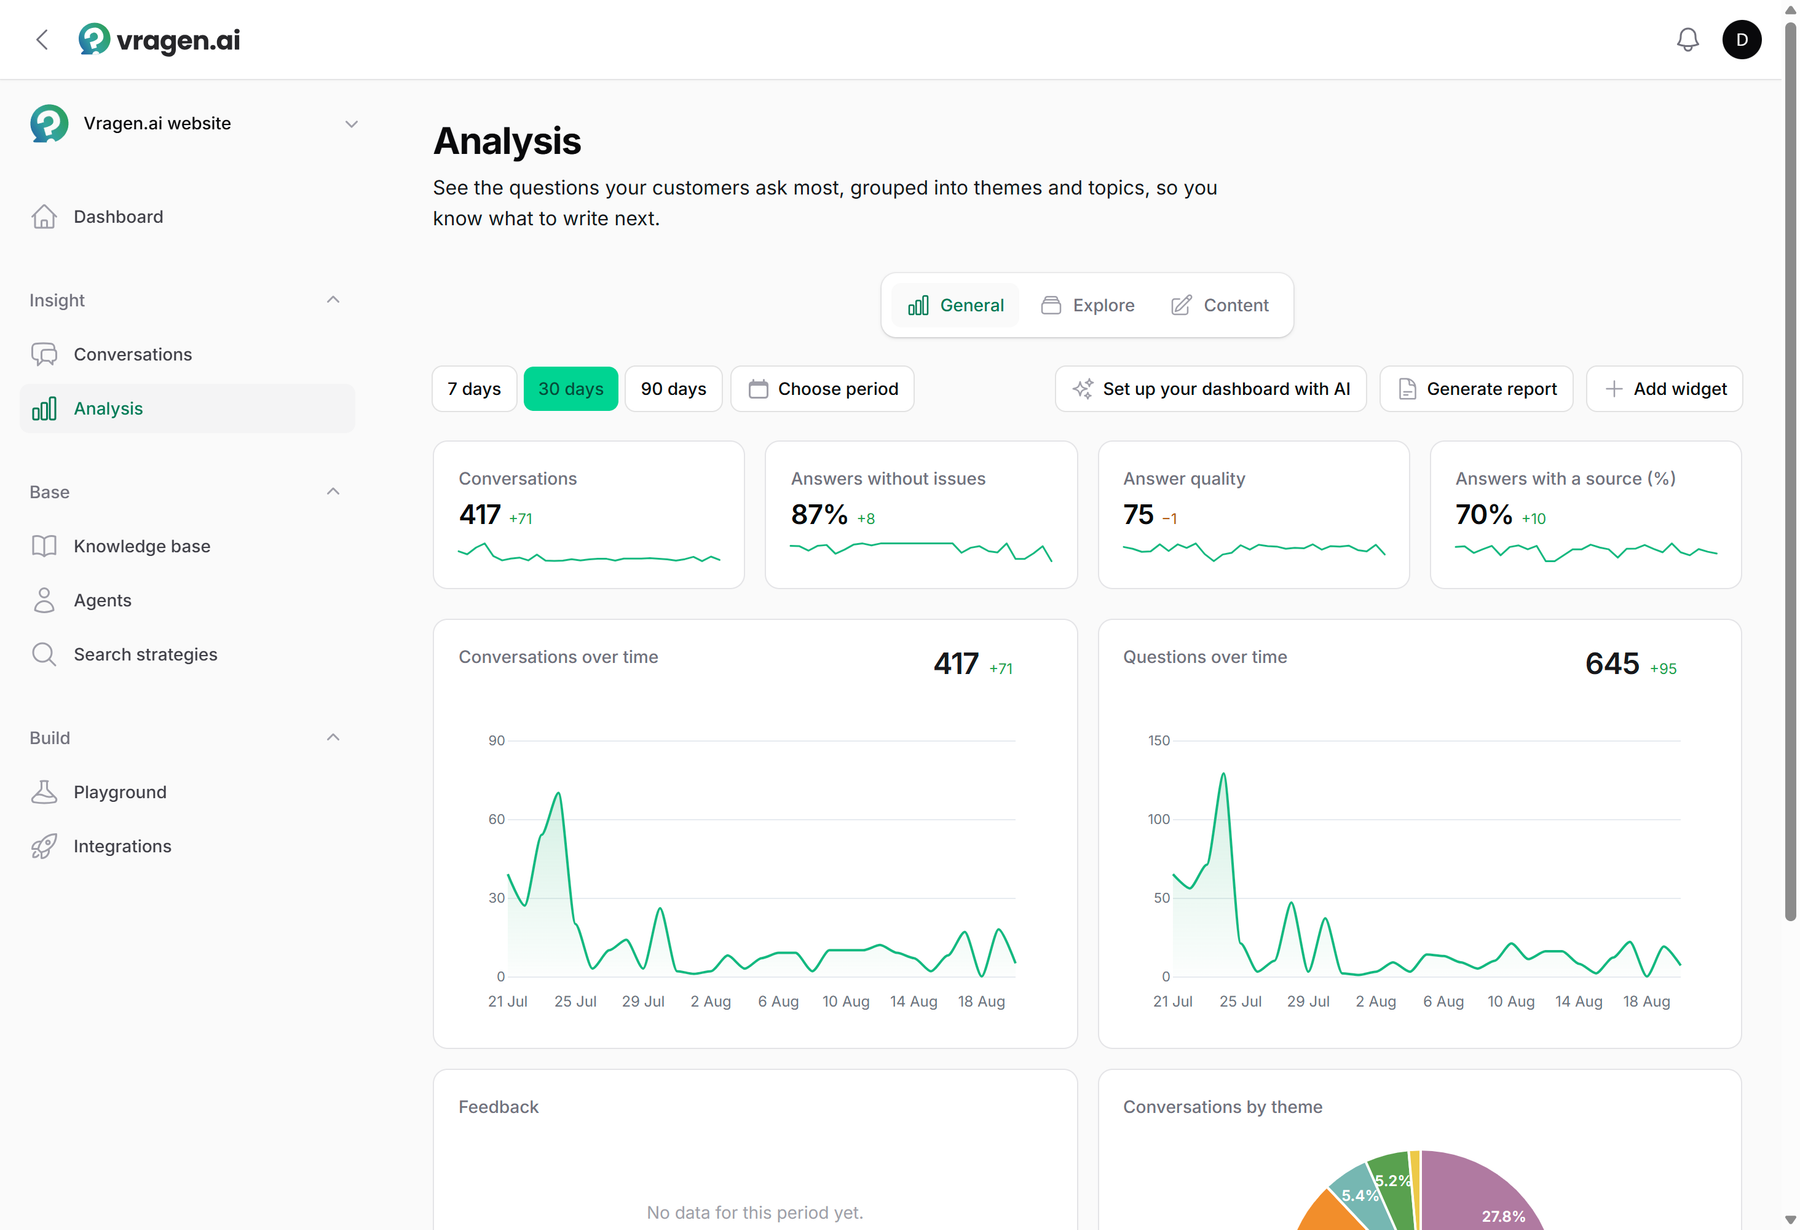
The screen has three tabs. General shows the numbers and trends, Explore the themes and topics themselves, and Content translates everything into concrete content opportunities.
Themes and topics, grouped automatically
vragen.ai groups questions in two layers: broad themes (such as "Pricing and costs") with specific topics underneath. New conversations are classified daily; the structure itself is sharpened weekly based on what is actually being asked. Anything that fits nowhere lands in the fixed catch-all "Other", so nothing quietly disappears.
The Explore tab is where you browse that structure. At the top sit the biggest movers: the topics that rose or dropped hardest compared to the previous period, so a sudden spike never slips past you. Below them the themes appear as cards, each with its number of conversations, its trend and its quality scores; sort them by most conversations or by lowest quality.
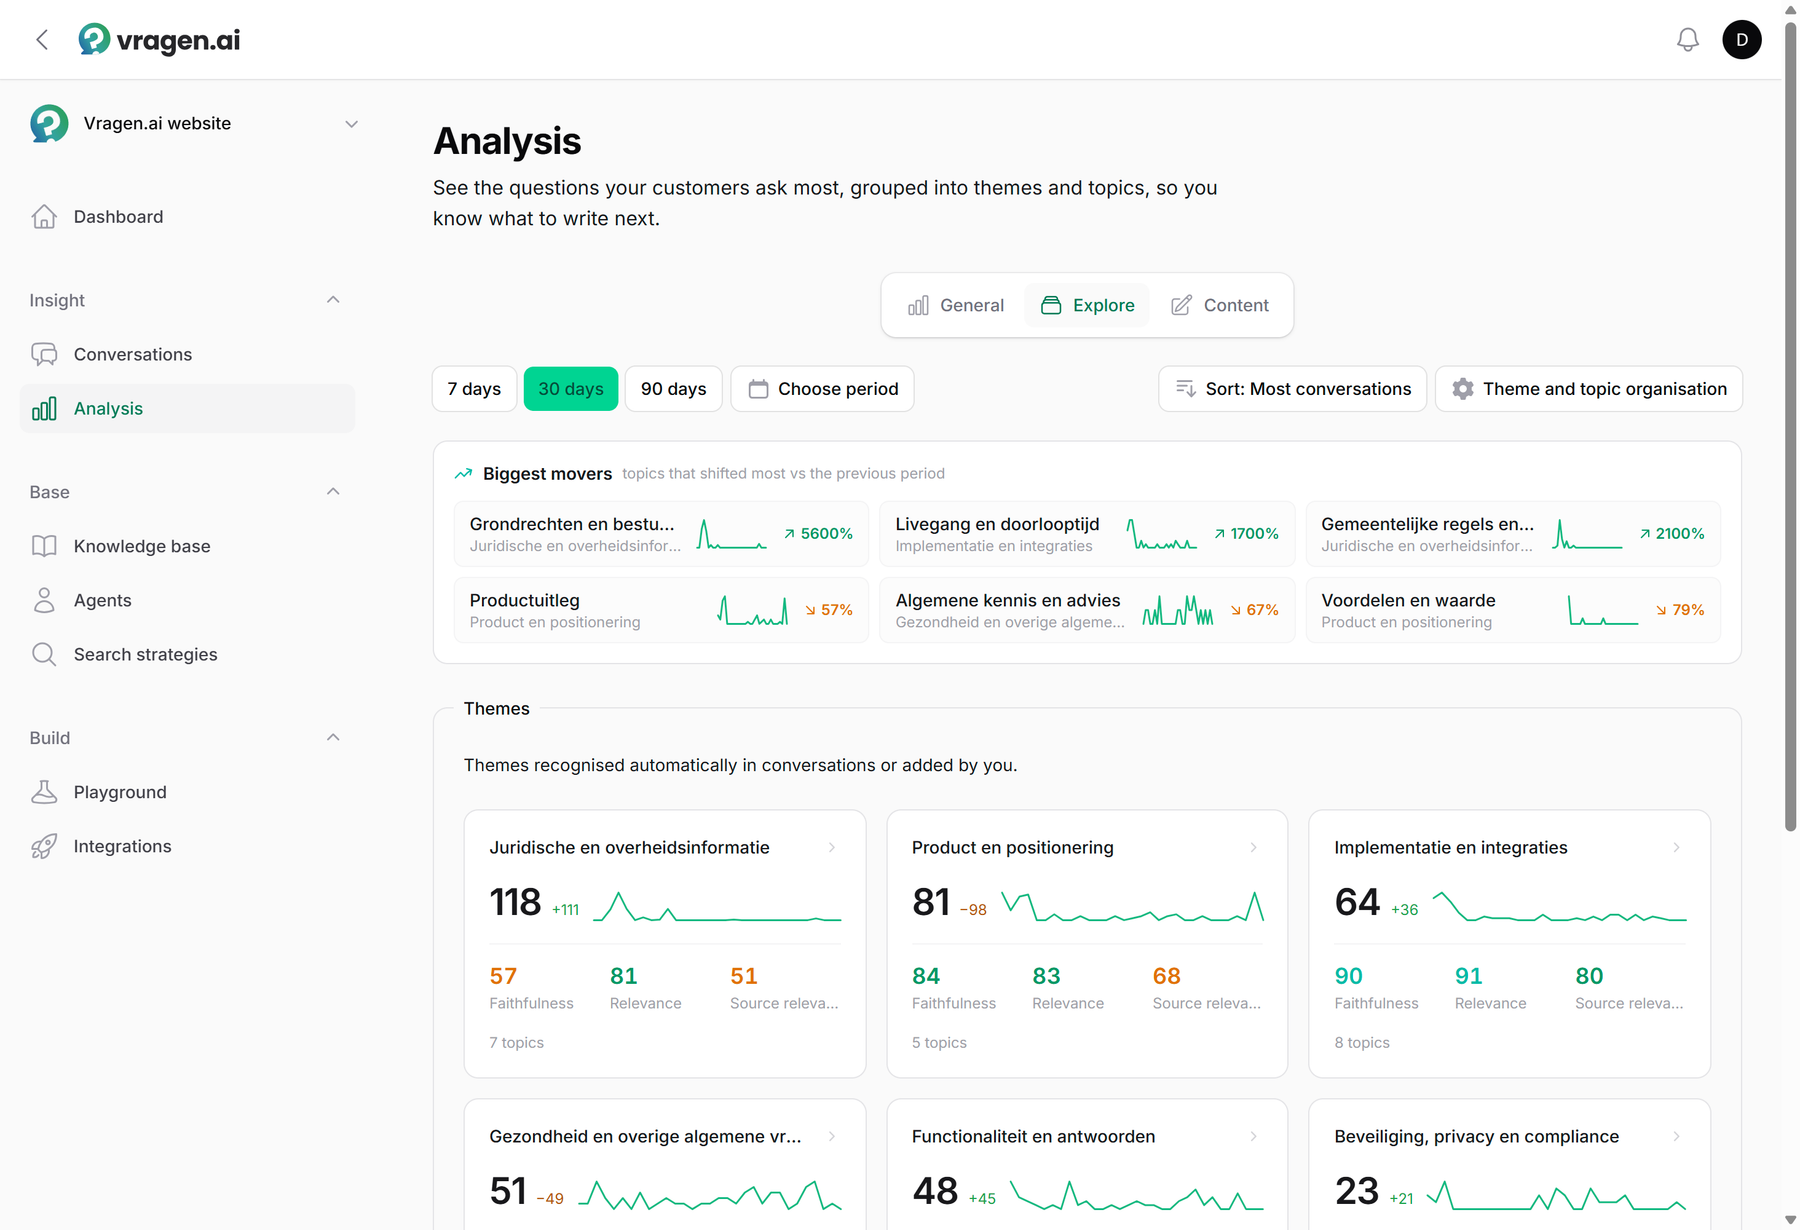
You stay in control. Rename a theme and that name sticks, even when the structure is rebuilt. You can merge, move or delete themes and topics, and turn the automatic sharpening off if you prefer; new conversations still get classified, only the structure itself stays the way you shaped it. From every theme you click through to the topics and the conversations behind it, so a striking number is always a few seconds away from being verified.
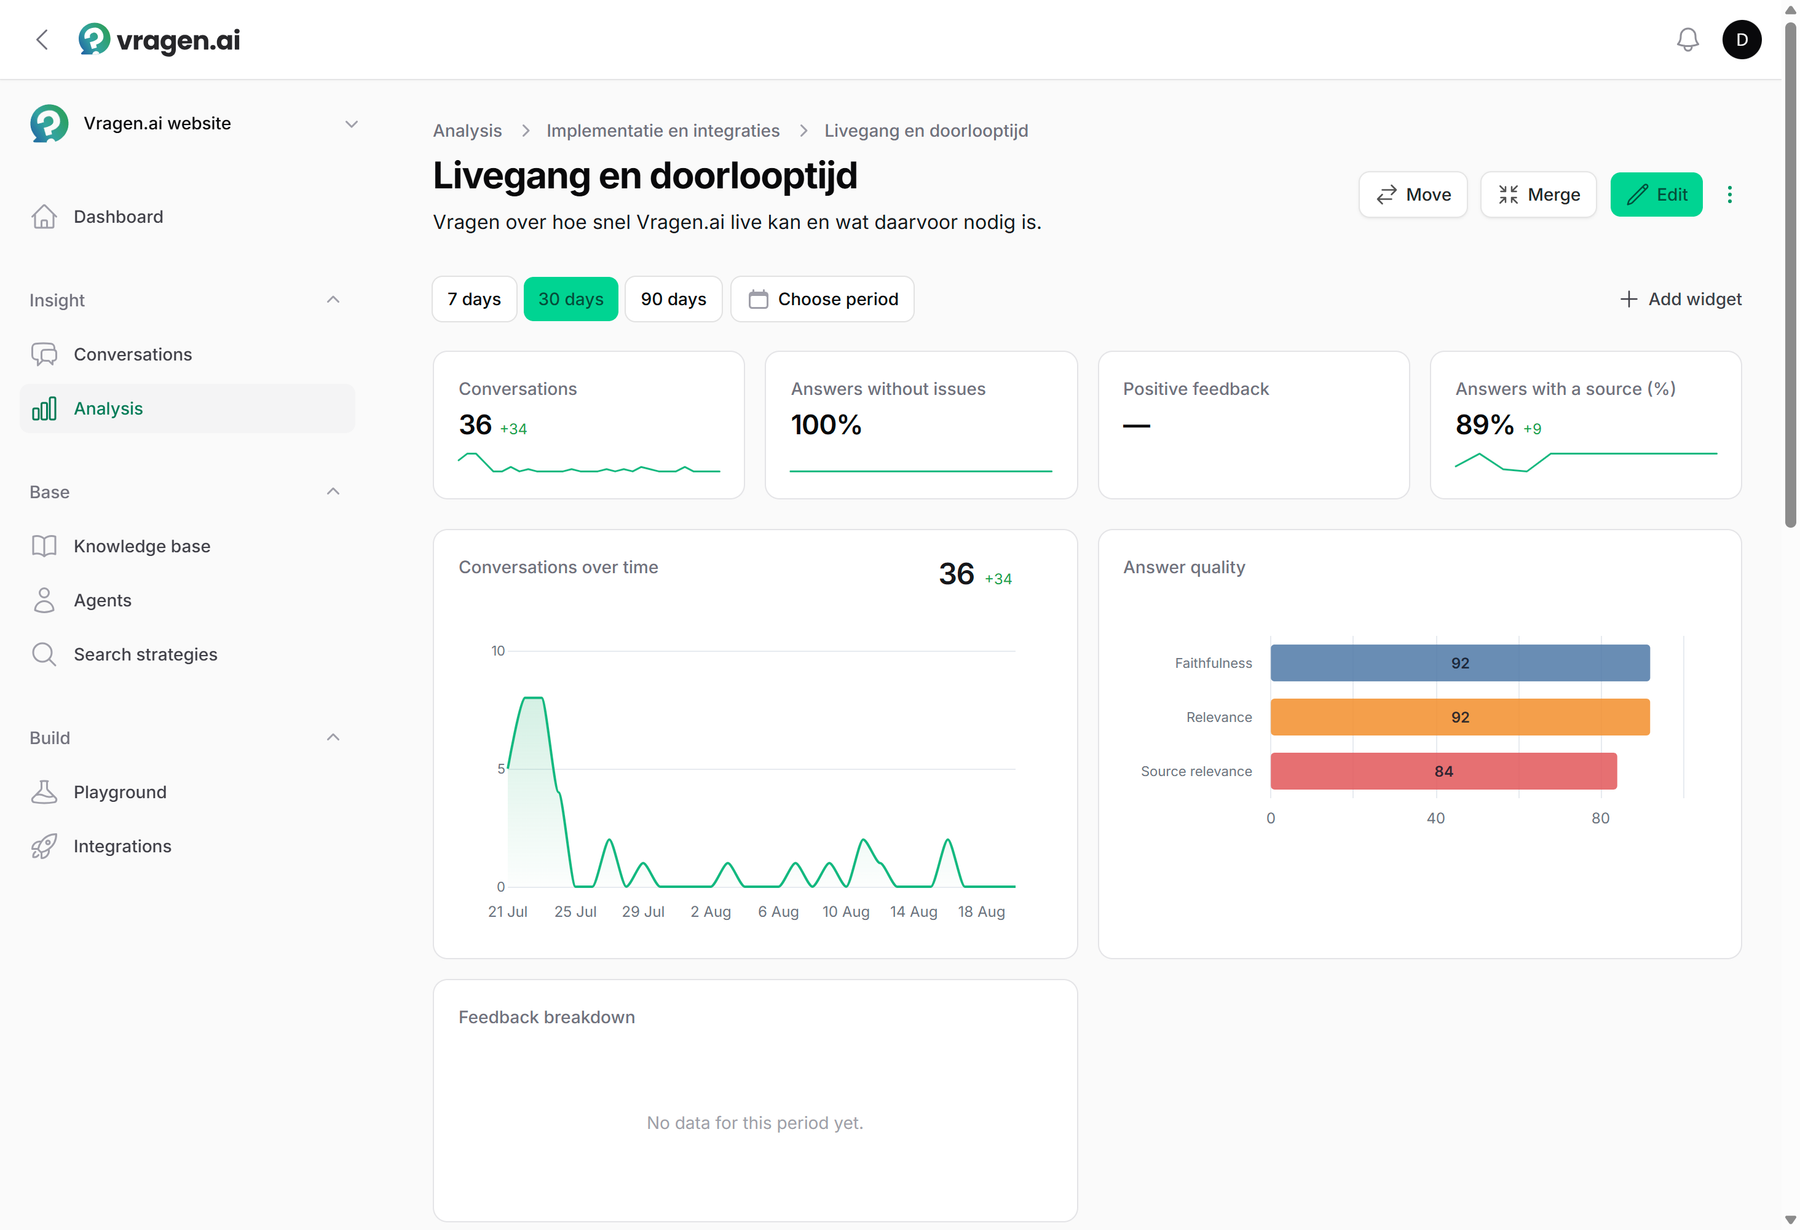
Every topic also has a page of its own with the same setup as the main screen: numbers, trends and quality scores, but for that topic only. You can add widgets there too, so a topic that matters to you gets its own dashboard.
A dashboard you configure yourself
The standard tiles (conversations, answer quality, feedback, answers with a source) are a starting point. With Add widget you build your own tiles and charts, and with the AI dashboard assistant you describe in plain language what you want to see: the AI rearranges the dashboard for you, with an undo if it should be different after all. You pick the period at the top of the screen: a fixed range or your own from-to range. Every period is compared with the equally long period before it, so a shift stands out right away.
Behind every countable number sit the conversations themselves. Click a tile such as conversations, questions, positive feedback or interrupted answers, and the inbox opens with exactly those conversations, in the same period and within the same theme or topic. Click answer quality and the weakest answers come first. A day in a trend chart opens that day's conversations, and a slice of the themes chart takes you to that theme's page. So a striking number never stays a mystery: two clicks later you are reading what visitors actually asked. Averages are not clickable, because there is no specific set of conversations behind them.
The AI report: numbers with a story
With Generate report, vragen.ai writes an interpretation of the numbers for the chosen period: what stands out, what goes well and what needs attention, backed by real example conversations you can click straight through to. You can pass a focus ("look at the pricing questions in particular"), and the report is written in your environment's content language. Useful for your monthly meeting: the numbers and the story come from the same screen. The report is a snapshot, though; switch periods and it disappears. So copy the text if you want to use it as an attachment.
From insight to content
The Content tab closes the loop. At the top sit the content opportunities: a ranked, AI-written list of the topics where new content pays off most, with the number of conversations and what exactly is missing per opportunity. The list honestly says it is AI-generated; Refresh advice requests a fresh version.
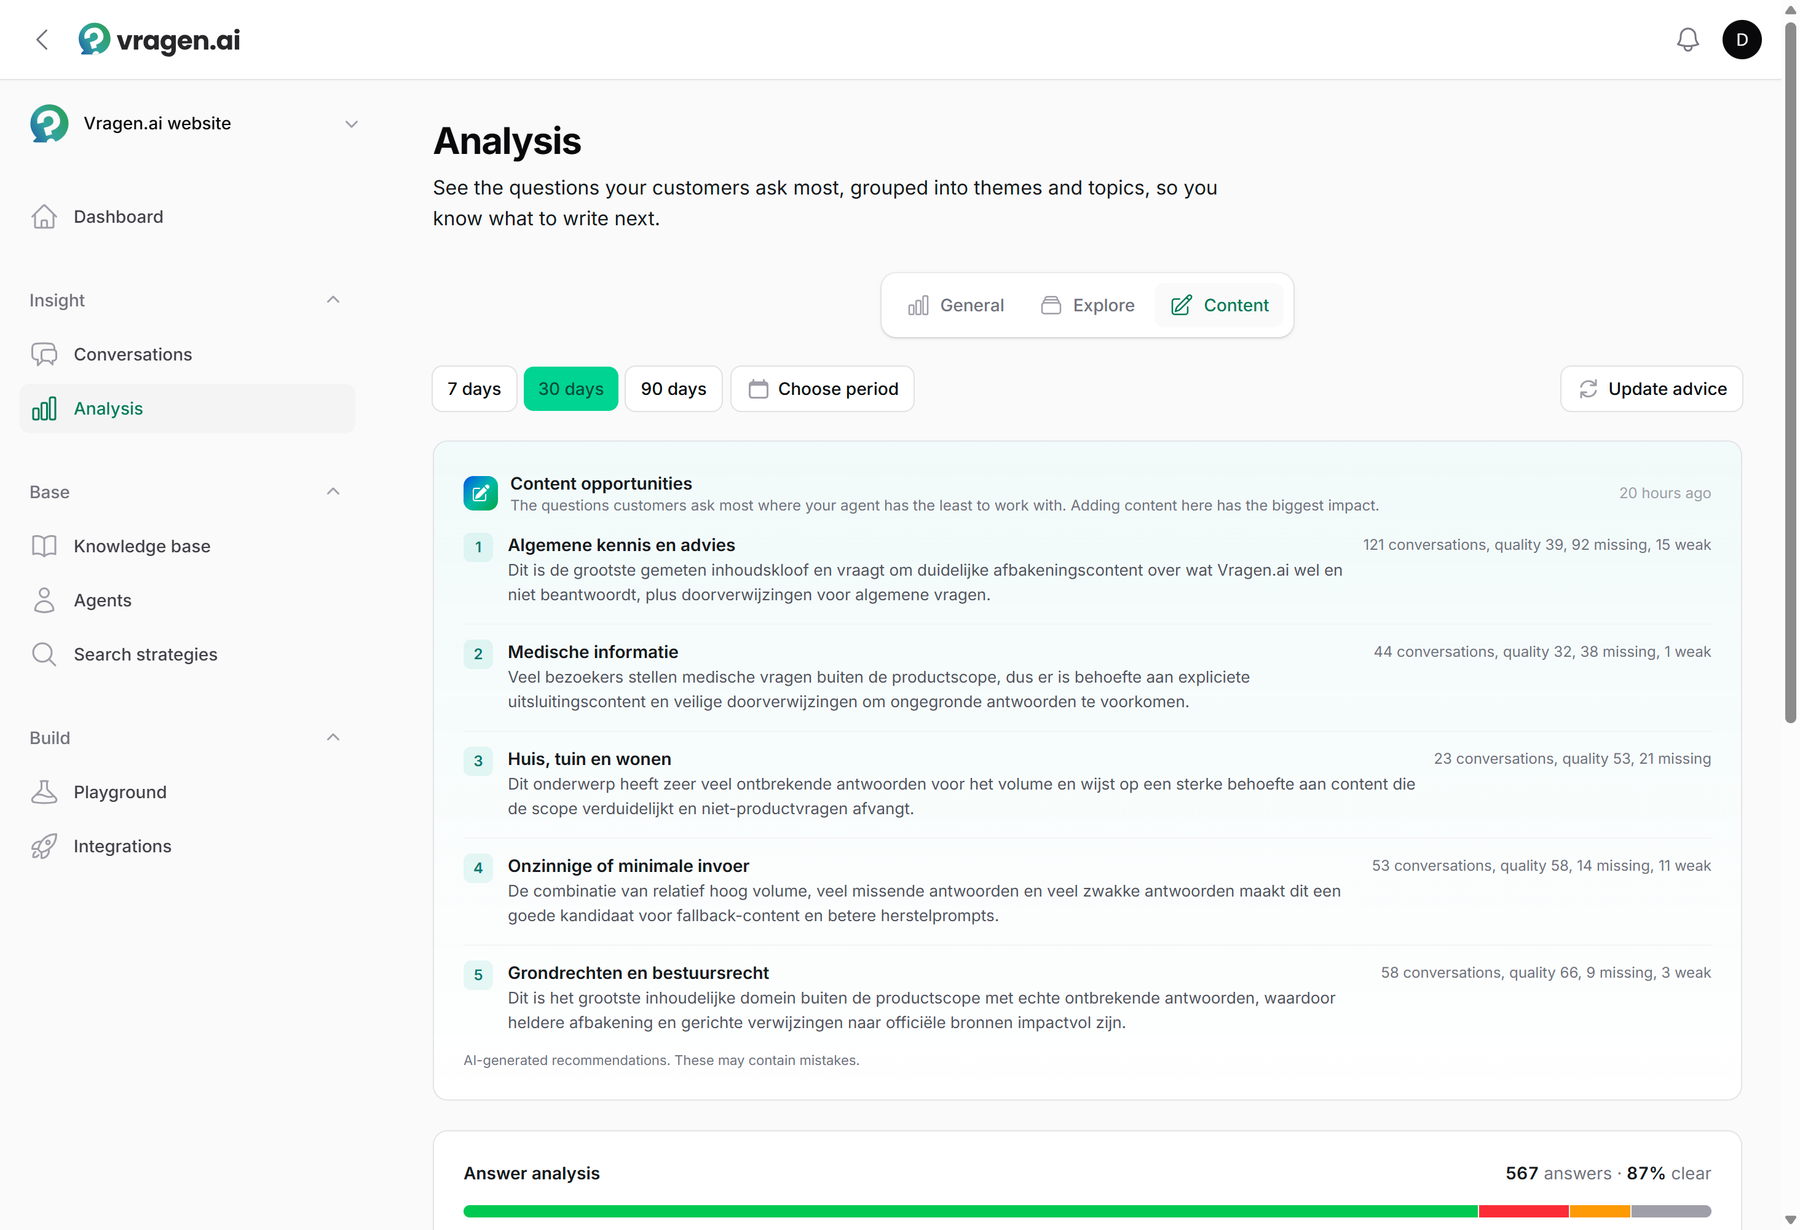
Below it sits the answer analysis: which share of the answers was fine, and where things pinched. Under "Missing content" you find the questions your site had no good answer to; "Improve content" shows where the answer existed but fell short. Interrupted conversations and answers blocked by your content policy each have a segment of their own too; for an interrupted answer you can see whether the visitor stopped it themselves or something broke technically. Every segment is clickable and takes you to the related conversations, so you know exactly which page needs to be written or extended. How to get that content into your knowledge base is covered in Managing knowledge base content.
Who can do what
Analysis is open to everyone from the Annotator role up, but not everyone may do the same things. An Annotator reads along: the numbers, the themes and the content opportunities, without changing any of it. Rearranging the dashboard, adding or hiding tiles and generating a report start at the Editor role, which also curates the structure of themes and topics. More about the roles: Managing users and roles.